
Q.E.D. Economics was seeking to develop North Dakota by the Numbers, for dissemination of and discussion about data products and analysis focusing on North Dakota. It is part of a larger web site and it needed to be easy to use, a reliable source for economic data and analysis, and a powerful tool that current and future customers can utilize in their decision processes.
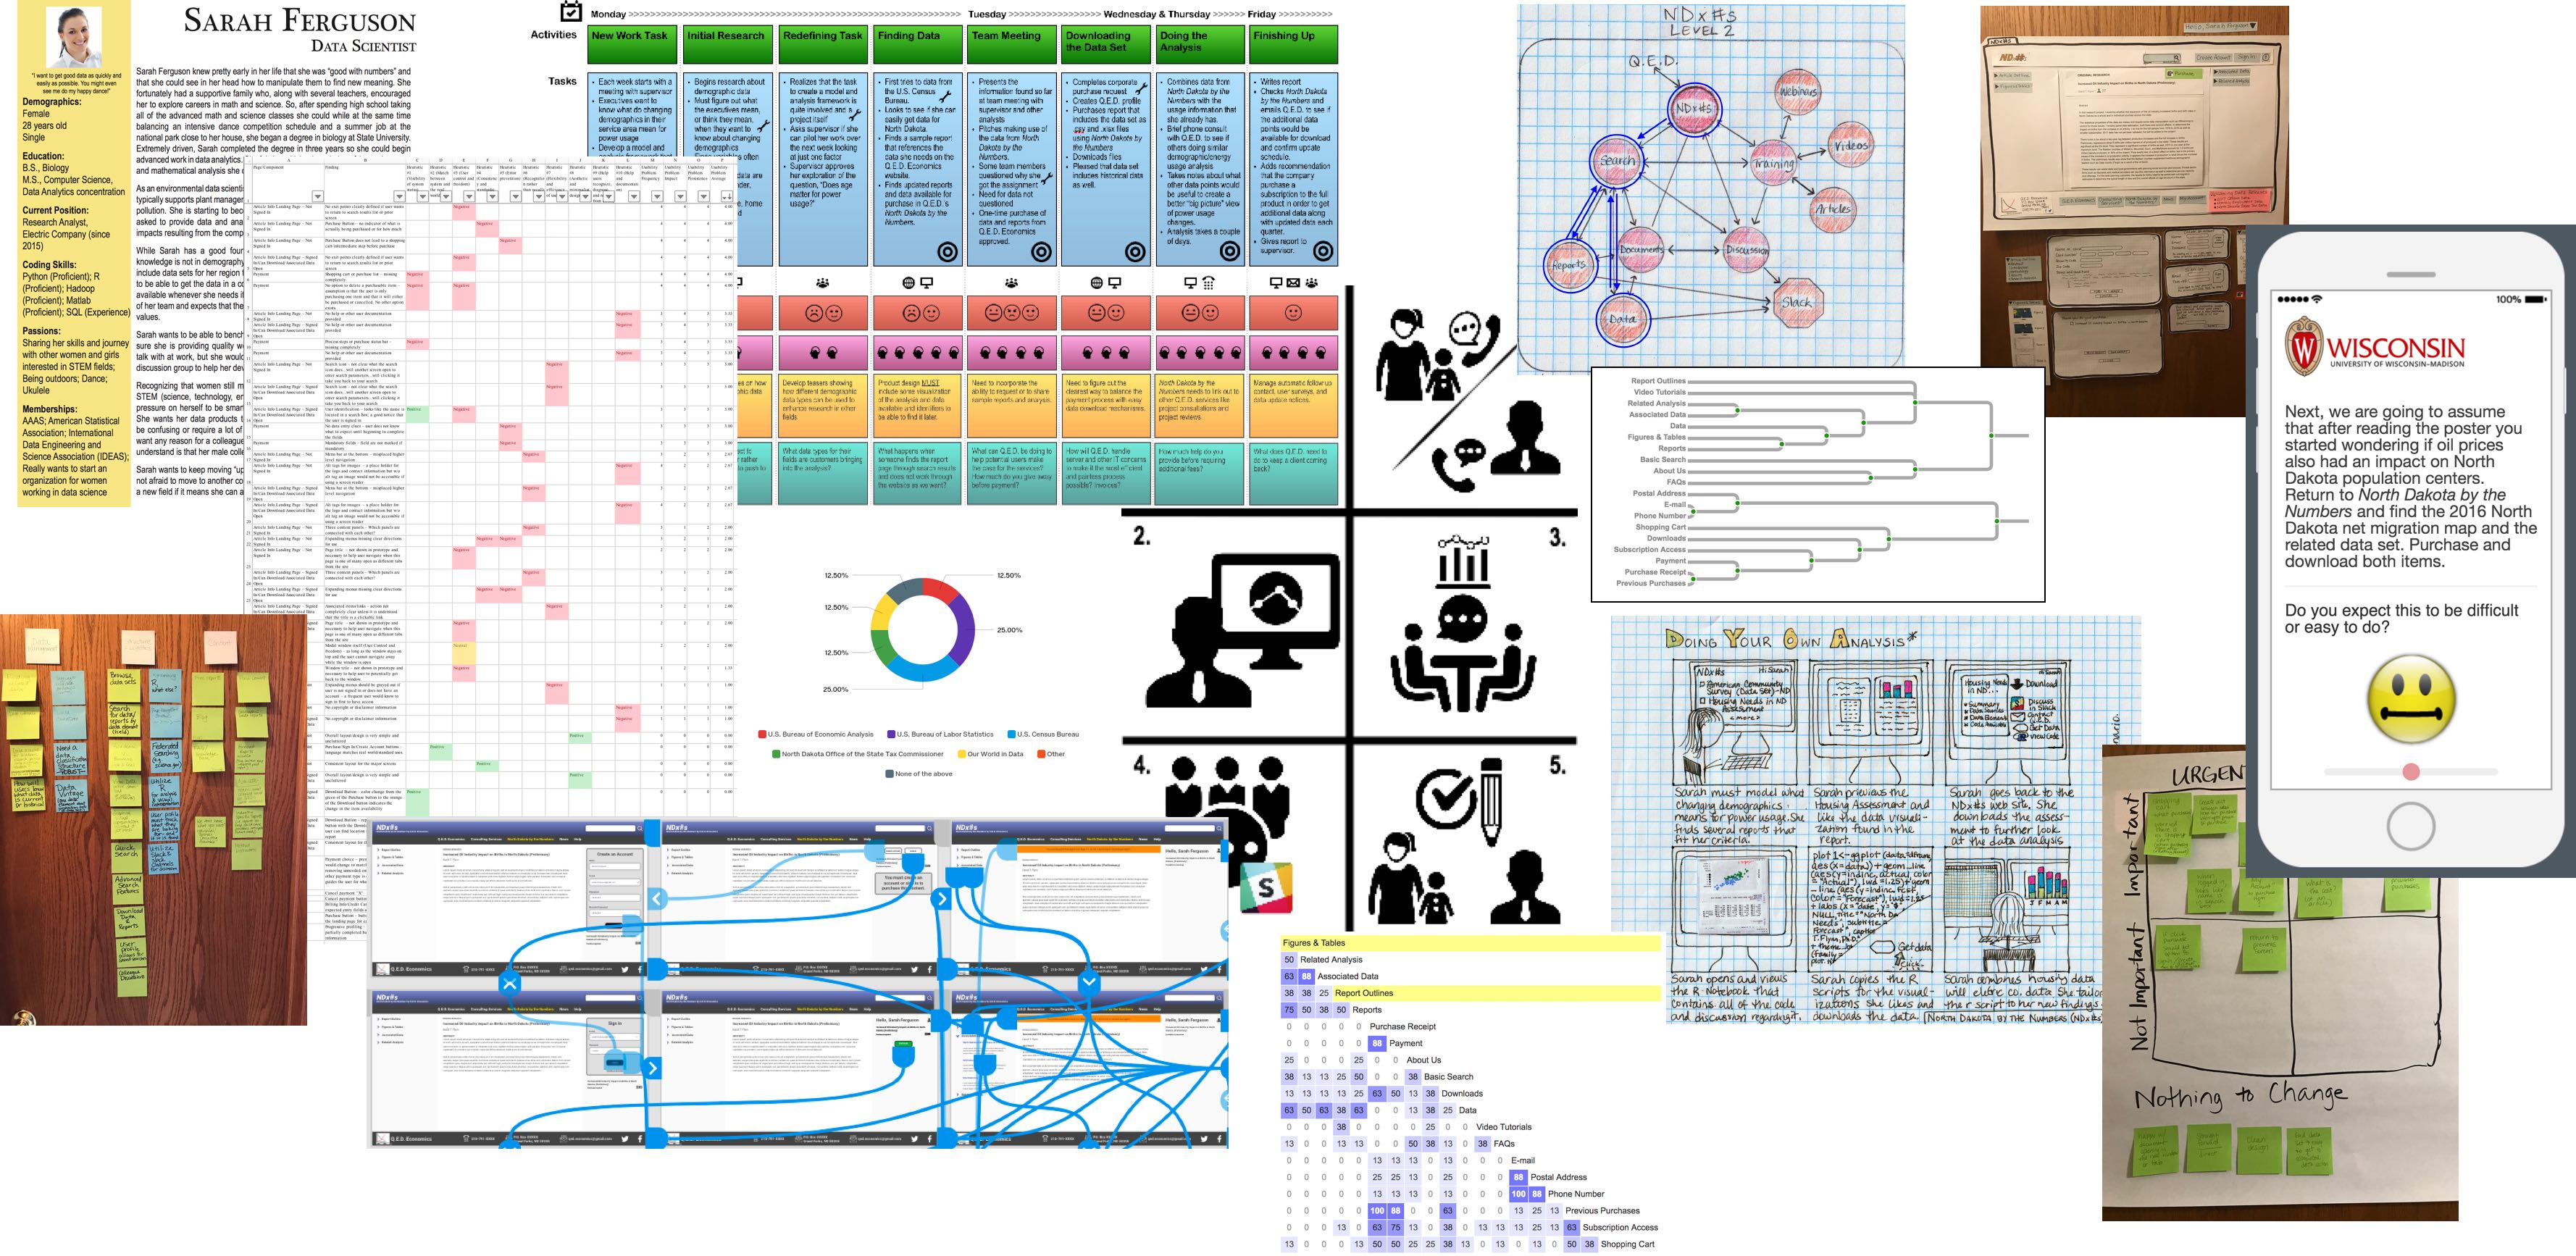
The images included here represent many of the products and artifacts of the project, several of which I referred to many times during various iterations. Early on in the project, we identified two key user groups: economic developers, also known as economic development professionals, and data analysts or scientists.
We then created user personas along with broad scenarios describing how we thought North Dakota by the Numbers would be used. All of this information along with continual feedback and analysis helped us create a user journey map and other documentation that guided the initial design process.
The hi-fidelity prototype developed in XD was okay for testing some flat scenarios that did not require a user to move around too much on the site. But, the card sort testing done after this prototype was developed showed that potential users were a bit all over the place trying to categorize the basic elements of the broad Q.E.D. Economics website, including the North Dakota by the Numbers section. It became clear to me that I needed to determine if North Dakota by the Numbers could be a section within the Q.E.D. Economics web site or if it needed to be a standalone product.
As we learned more about different usability testing methods and their associated metrics, I continued to study the needs of my project. I was very bothered by the site architecture and I needed to know if there was another way to test the architecture. I eventually decided that a simple but live testing site would be needed.
I created the live demonstration environment utilizing WordPress and several plugins like WooCommerce in order to better test the necessary site architecture and components.
Utilizing this site, the latest round of usability testing has focused on components of North Dakota by the Numbers involved with creating a user account, logging in as an existing user, purchasing and accessing reports and data, and contacting Q.E.D. Economics. The study included the collection of both qualitative and quantitative measures focusing on usability, satisfaction, and general accessibility.
What is next?
Q.E.D. Economics’ problem was how to meaningfully deliver data and analysis to customers. Whether you want to call me a UX Researcher, a UX Designer, a Content Strategist, or an Information Architect, UX was an important part of an iterative process to design a rich website that fits Q.E.D. Economics’ needs.
After we finish this process, Q.E.D. will be able to hand a comprehensive, user-centered design to a developer to complete the website.